Zoomforth Web App
User research • Wireframes • Mockups
• Prototypes • Usability studies •
Front-end
development • Analytics
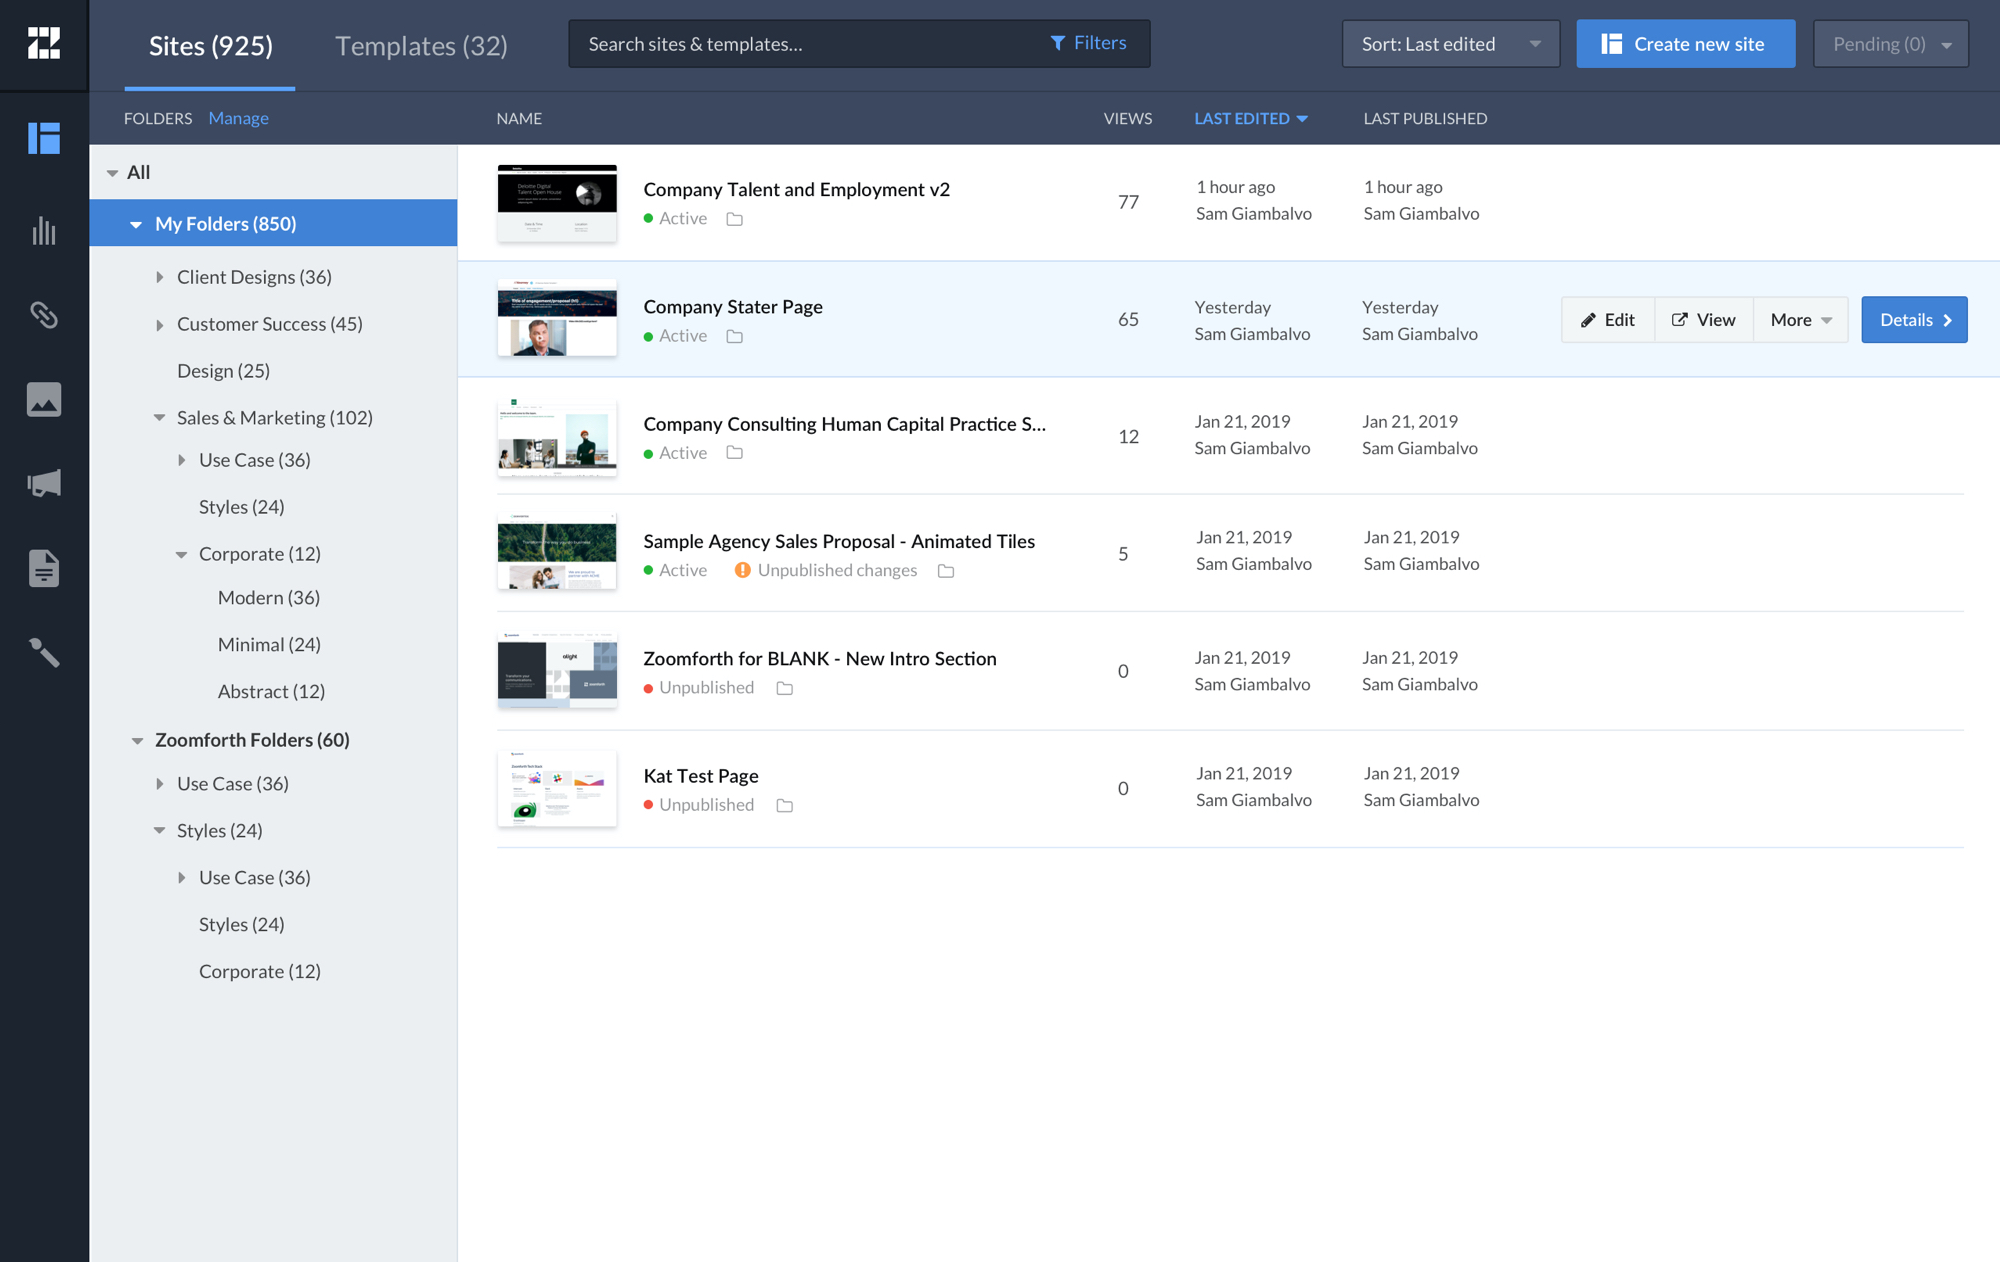
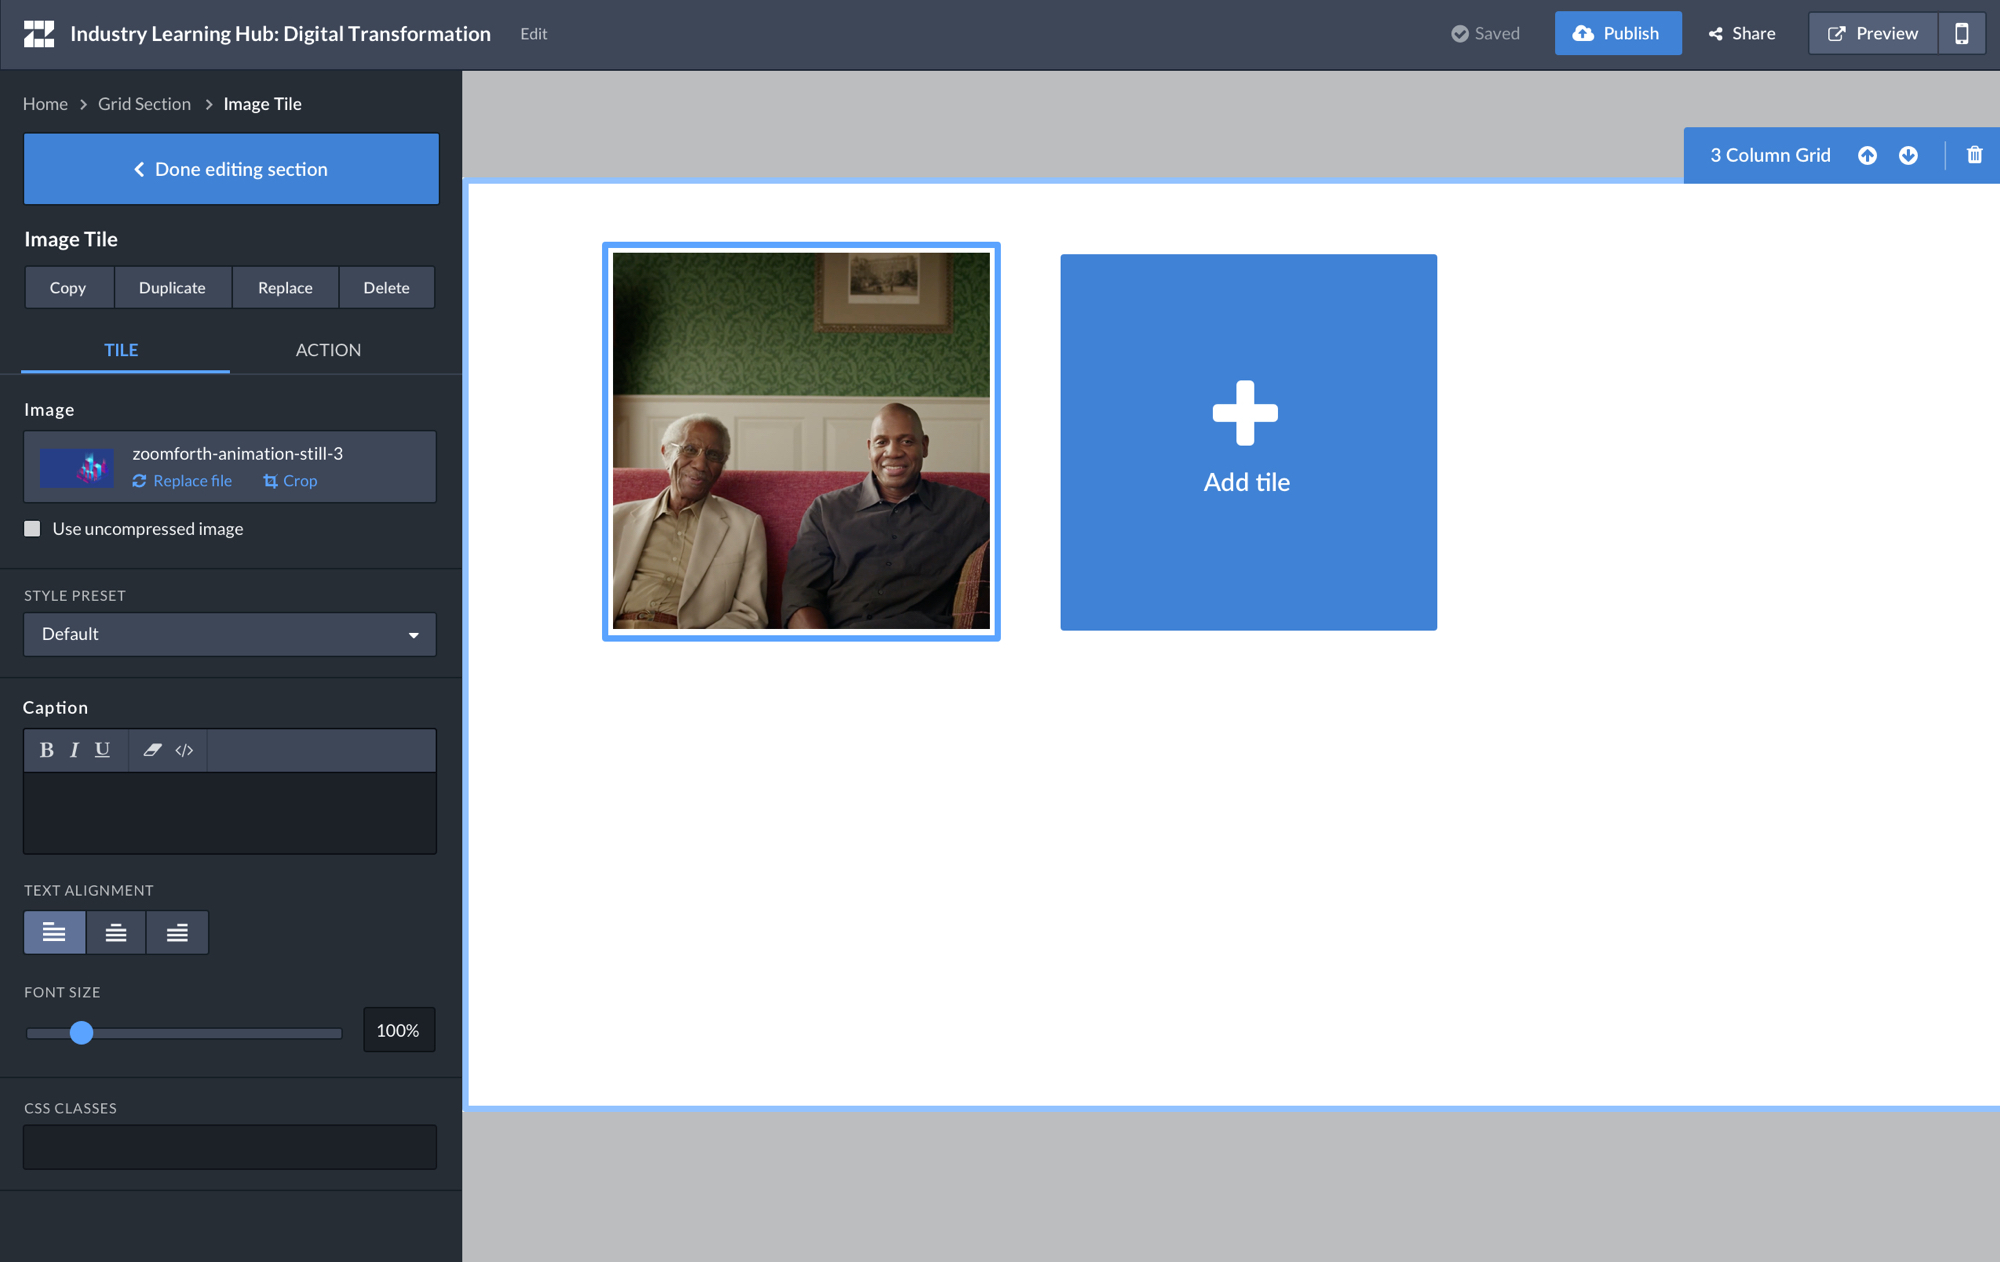
I worked with Zoomforth to design and develop a best-in-class platform to build media-rich, interactive websites. Three of the Big 4 consulting firms used our technology to revolutionize their corporate communications.
1. Consultants creating sales proposals
2. Recuruiters making career pages
3. Instructors building internal learning resources
4. Web designers and developers
Goal #1: Increase user engagement
To prevent churn, we wanted to make sure users were getting the full value from the product and performing key actions.
Goal #2: Decrease time to first value
We observed a trend where teams that were quick to onboard, were more likely to successfully use Zoomforth to accomplish their own goals. As a result, these teams were more engaged and grew quickly. We set out to decrease the numbers of days it takes users to publish their first site and teams to deliver their first site to visitors.
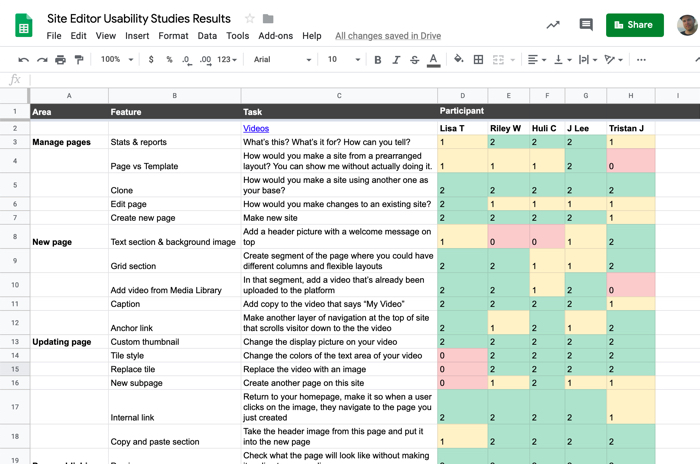
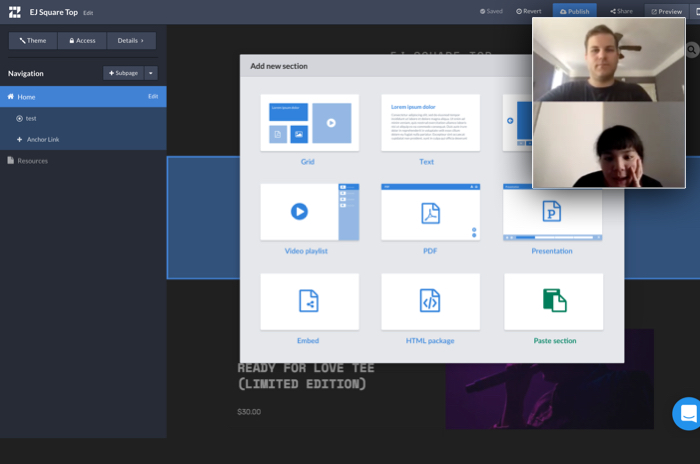
I met with 5 generalists and 5 designers to observe them accomplish different workflows in the app. I then set up analytics to measure the current status of our key performance indicators:
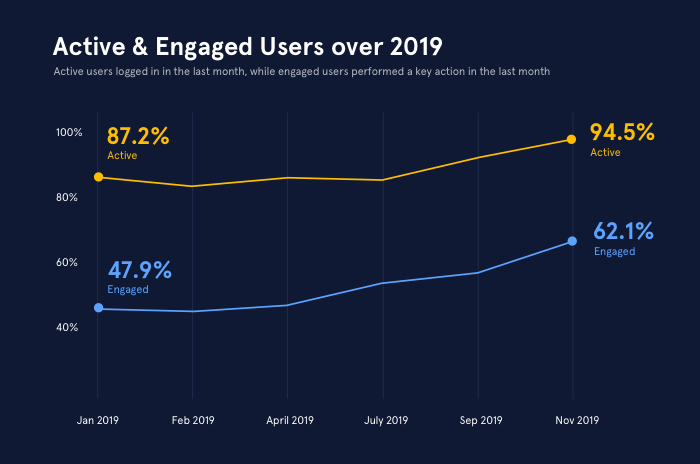
Active users: 87.2%
Engaged users: 47.9%
Avg days to user’s first publish: 41
Avg days to team’s first visit: 51
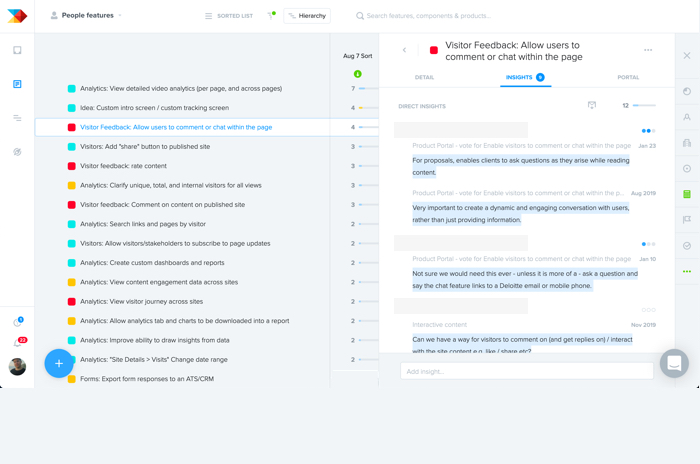
We used ProductBoard to collect insights from customer discovery interviews, support conversations, sales calls, usability studies, and internal feedback. We created a prioritized list of features and improvements that would contribute to our goals. Then, engineers gave us difficulty estimates and we agreed on a development timeline and split up the work into sprints.
I used Sketch and InVision to create mocks and prototypes, solicited feedback from our team and external stakeholders. After engineers developed a feature, I refined the CSS, pushed to a staging server, and guided our support team as they QA'd different browsers and devices.
I also collaborated with internal teams to organize a new onboarding process, with new tutorial videos, as well as branded assets to get new customers up and running.
As we launched new features, we messaged users through Intercom, and we updated our public Productboard portal so users could leave comments. We found that our development efforts successfully contributed to our goals by measuring key performance indicitators at the end of 2019:
Active users: 94.5% Δ +7.3%
Engaged users: 62.1% Δ +14.2%
Avg days to user’s first publish: 33 days Δ -8 days
Avg days to team’s first visit: 40 Δ -11 days
– Eric Thibault, Appian
– Deniz Gültekin, Lever